Marc Chaikin is a former Wall Street investment guru known for developing the Chaikin Money Flow indicator and numerous stock-selection models.
And in late 2021, he launched a service called the Power Gauge Report to “bring his knowledge to everyday investors,” which is sold by Chaikin Analytics.
Is it legit and worth it?
After joining the Power Gauge Report, I have to say that I like the stock rating software tool (known as “Power Pulse”) that you get access to.
As a member, you can use this tool to analyze 1,000s of individual companies and get a “bullish” or “bearish” rating based on 20 different factors, which in a nutshell, are related to a company’s operations and stock performance.
You also get monthly newsletters (aka reports) where Marc Chaikin breaks down his thesis on a new stock he’s recommending and updates you on his existing picks, which can all be found in the model portfolio.
All in all, it’s pretty cool.
That said, no stock-rating system is ever 100% accurate, which is evidenced by the recent performance of the service’s stock picks (more on this shortly).
Also, I don’t think the service will suit those looking for broader macro insights, as Marc Chaikin sticks mostly to analyzing individual stocks in the reports.
So to sum it up… yes, the service is definitely legit. And for $49, I’d say it’s well worth it. But as with any service, it’s unlikely to suit everyone.
Ahead, I’ll show you everything I learned as a member to help you make a more informed choice about whether or not this service is right for you.
Here’s an overview of what we’ll be discussing:
- Overview of the Chaikin Power Gauge Report
- Walkthrough of the Power Gauge Ratings
- How Have the Stock Picks Performed?
- Is Marc Chaikin the Real Deal?
- Bottom Line: Worth It or Nah?
Click above to skip to a section, or read on for the full review.
Overview of the Chaikin Power Gauge Report
The Chaikin Power Gauge Report is an investment research service based around a software tool Marc Chaikin developed called the “Power Gauge.”
In short, the Power Gauge is a quantitative tool that measures a company’s performance based on 20 pre-defined metrics Marc Chaikin has programmed into it. And it gives you an overall rating of whether it rates the stock as:
- Very Bullish
- Bullish
- Neutral
- Bearish
- Very Bearish
I’ll go into more detail on how this tool works shortly.
But that’s the gist of it.
And this tool, along with two technical indicators Chaikin uses (the Chaikin Money Flow and Relative Strength indicators), is how he chooses stocks.
Each month, Marc Chaikin recommends a new company that the system is “bullish” on, and he does a complete writeup of that company in the newsletter, so you know exactly why he’s recommending it.
He also shows you how the company he’s recommending aligns with the ratings shown in the Power Gauge in a way that’s easy to follow.
Here’s a preview of one newsletter to show you what I mean:
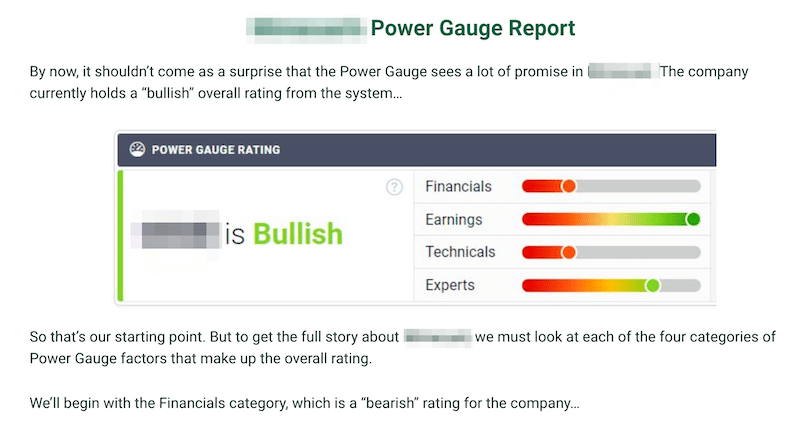
All in all, I’ve found the analysis Marc Chaikin puts into each newsletter to be very informative. Instead of just sharing a stock he likes, Chaikin explains the ratings the system has given the stock, why he’s recommending it, and the specific details of his recommendation (i.e., ticker, when to buy, how long to hold, etc.).
Not to mention, you can use the software tool yourself at any time, so you can punch in the ticker whenever you like if you want to know more.
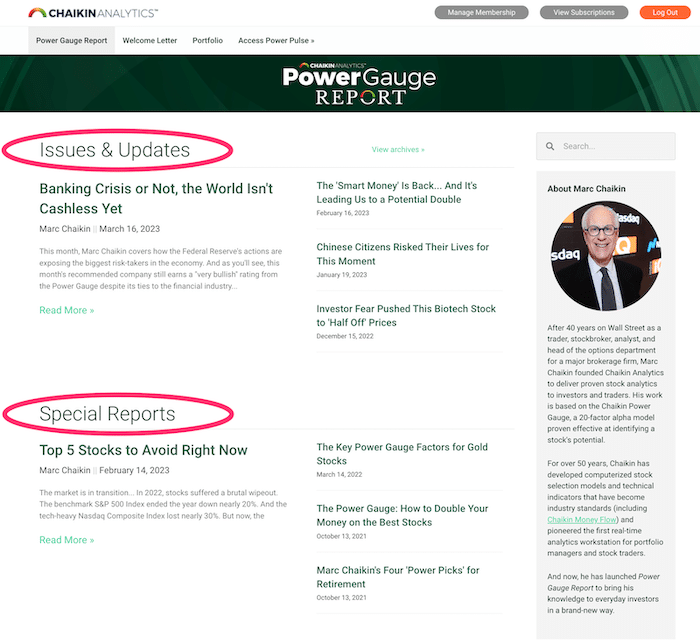
There are also “special reports” in the member’s area that feature different stocks he likes, a model portfolio that shows you all of his active picks, and a “welcome letter” that shows you what you need to do to get started.
How much does it cost?
The full price is $199, but I ended up joining through a promotion he’s running as part of his “financial reset in 2023” presentation, which allows you to sign up for the Power Gauge Report for $49 for the first year.
However, worth noting is that the service automatically renews at $199 per year thereafter, so it only costs $49 for the first 12 months.
Anyway, that’s the general idea of how the service works.
It’s similar to most other stock advisories I’ve reviewed in that you get a monthly newsletter and portfolio. The main difference is that, with the Power Gauge Report, you also get a full-fledged stock rating tool.
The only other services I’ve joined that offer something like this are those from Stansberry Research, but the rating system with those is very different.
Anyway, with all that said, let’s discuss how the Power Gauge rating system works in more detail, as this should help give you a better idea of what to expect.
Walkthrough of the Power Gauge Ratings
The Power Gauge ratings are part of a software tool called “Power Pulse,” and this tool is located in a separate section of the member’s area website where you can analyze over 5,000 different publicly listed companies and ETFs.
How does it work?
It’s pretty straightforward, all you need to do is type in the name of a stock you want to analyze, and if it’s in the system, you will see the rating.
Here’s an example of a company I punched into the system:
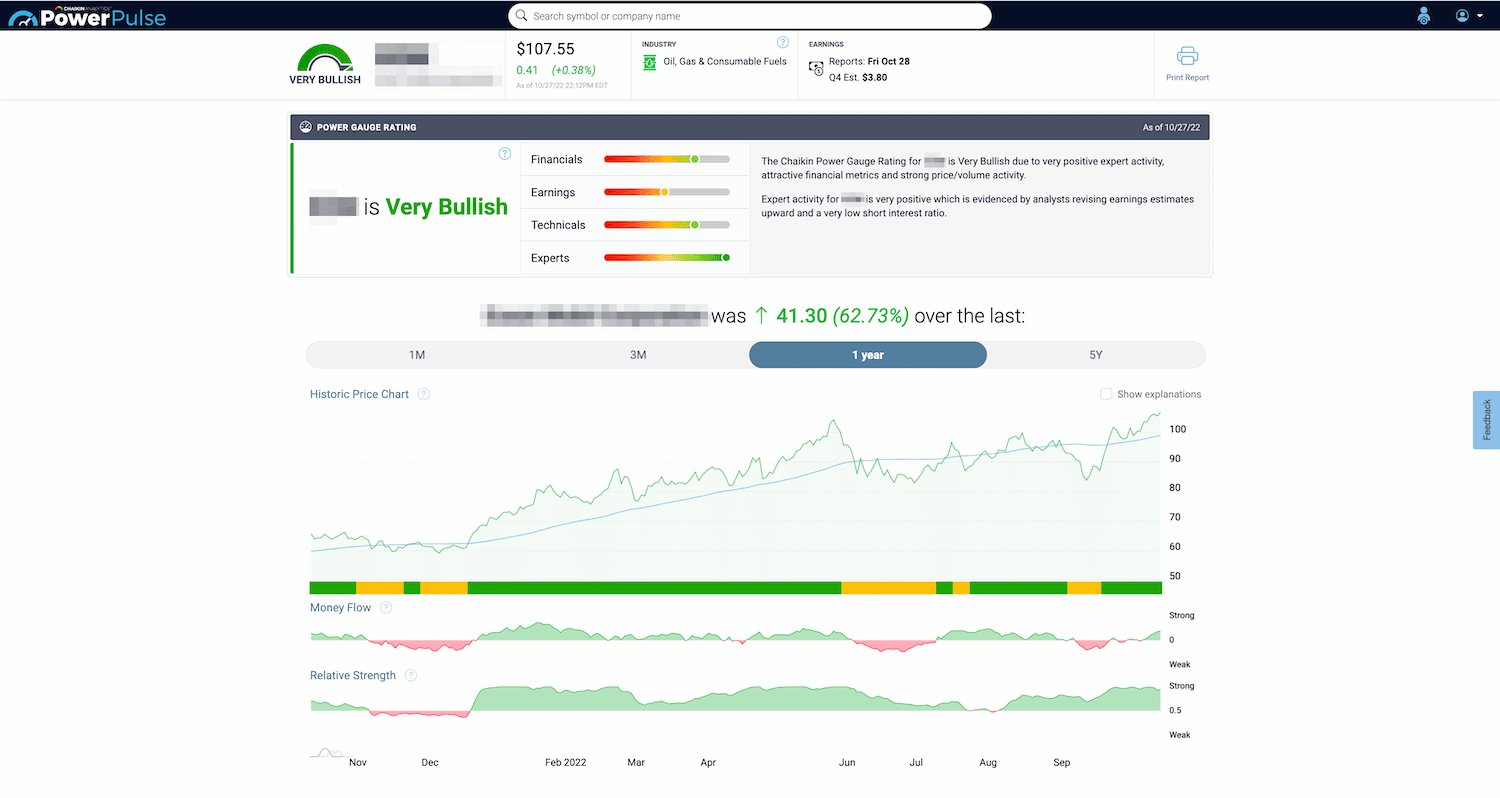
As you can see, the Power Gauge (aka Power Pulse) gives you an overall rating (in this case, “very bullish”), which is based on four broad categories that Chaikin defines as Financials, Earnings, Technicals, and Experts.
And within each of those, there are five individual metrics (20 metrics in total) used to rate each company and, ultimately, help you find awesome stocks.
The system also uses the “Chaikin Money Flow” and “Relative Strength” indicators as “timing measures” that Marc Chaikin says helps him choose stocks.
Let’s discuss each of these further, and I’ll give you an example of what each metric looks like when you type a ticker into the Power Gauge.
Financials
The first main metric is known as “Financials,” and this is designed to help evaluate the financial health and current valuations of a given company.
This metric includes the following five variables:
- Long-term Debt to Equity
- Price to Book
- Return on Equity
- Price to Sales
- Free Cash Flow
Here’s a screenshot of the “Financials” for the same company I used as an example earlier, a well-known company in the energy space:
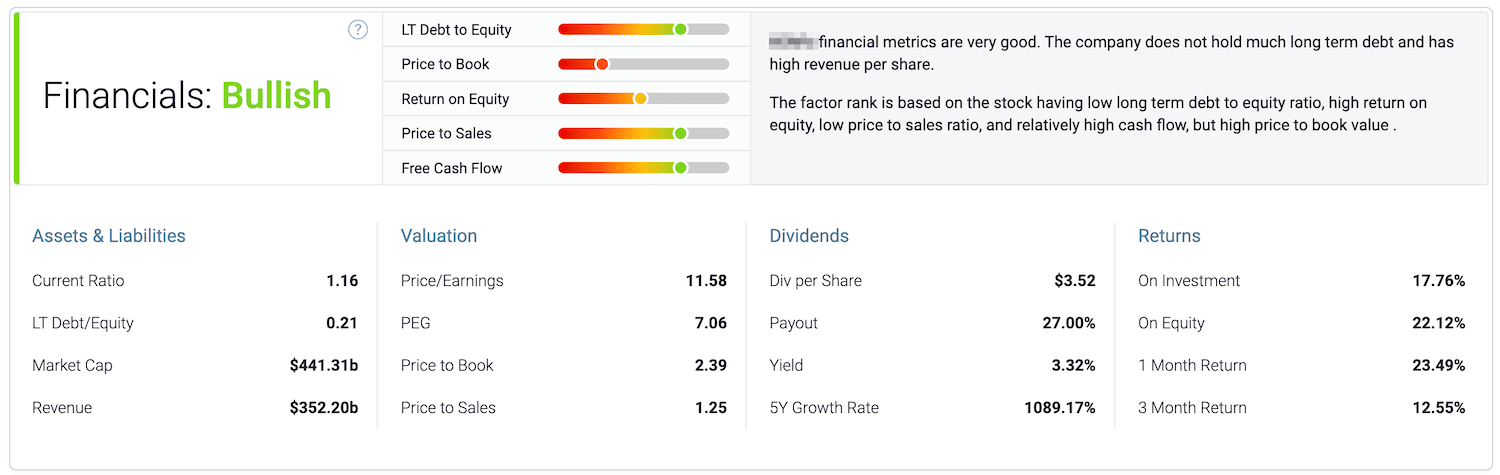
Not only do you get to see how the company stacks up against each of the five “financials” variables, but you can see a host of other related info such as the market cap, dividends, revenue, PE ratio… etc.
It’s pretty cool.
And very comprehensive.
Earnings
The Earnings metric takes the following into account:
- Earnings Growth
- Earnings Surprise
- Earnings Trend
- Projected P/E
- Earnings Consistency
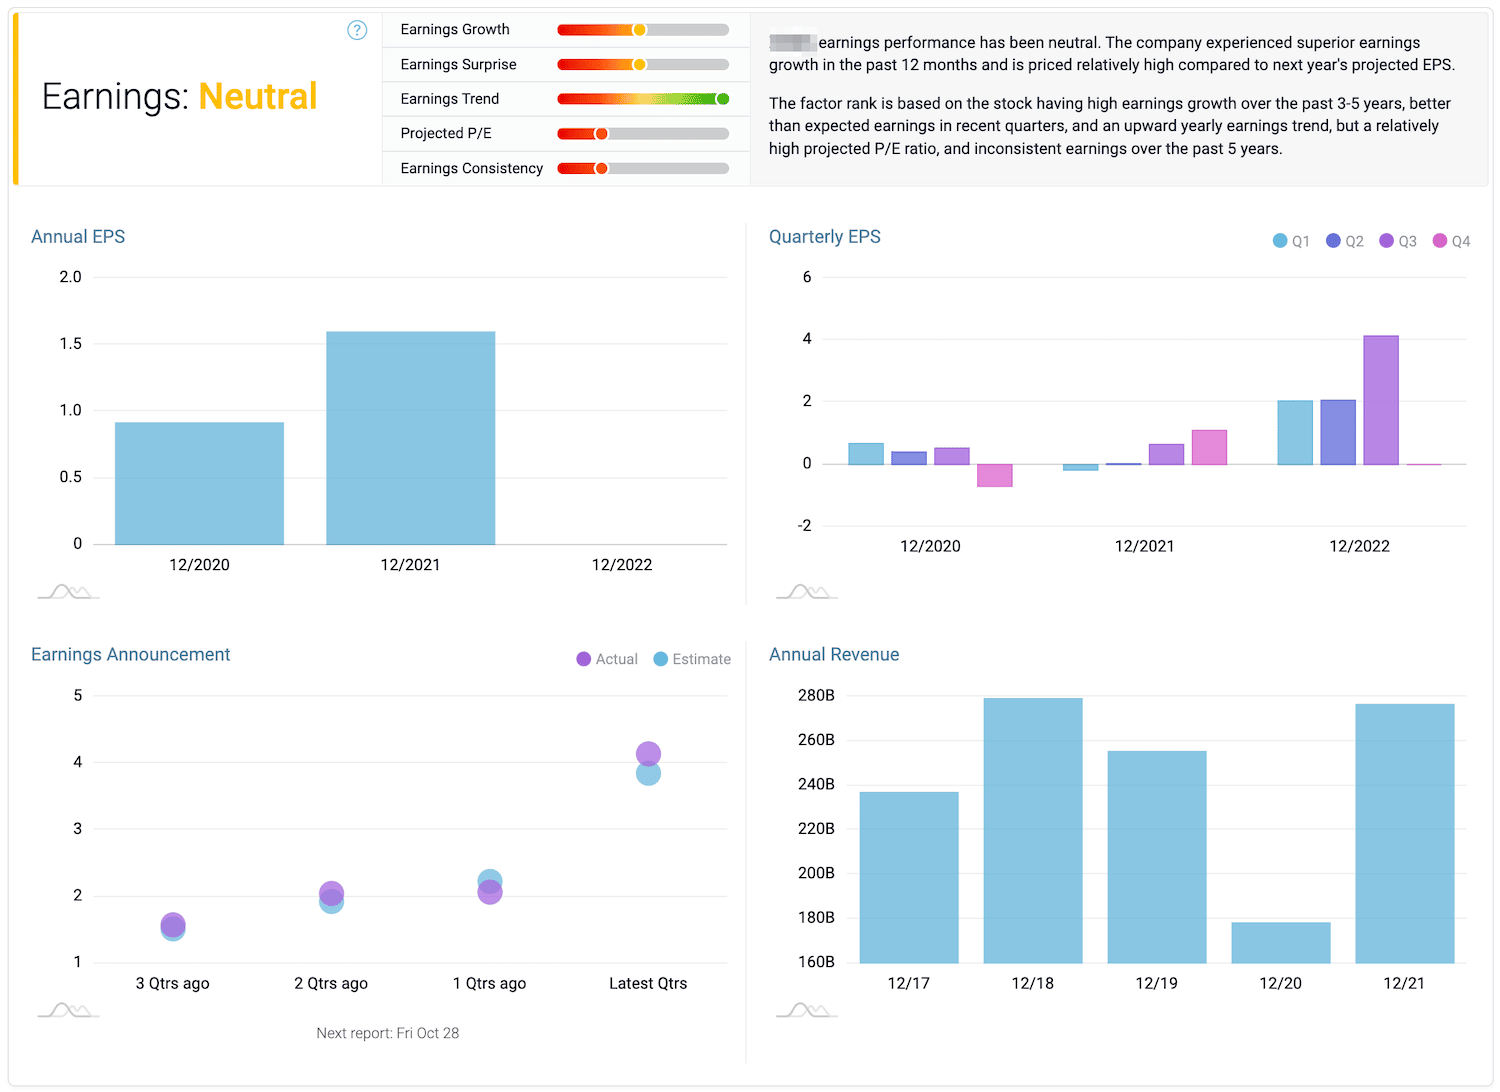
As you can see, the Earnings section gives you even more information, including four separate charts that break down the company’s earnings.
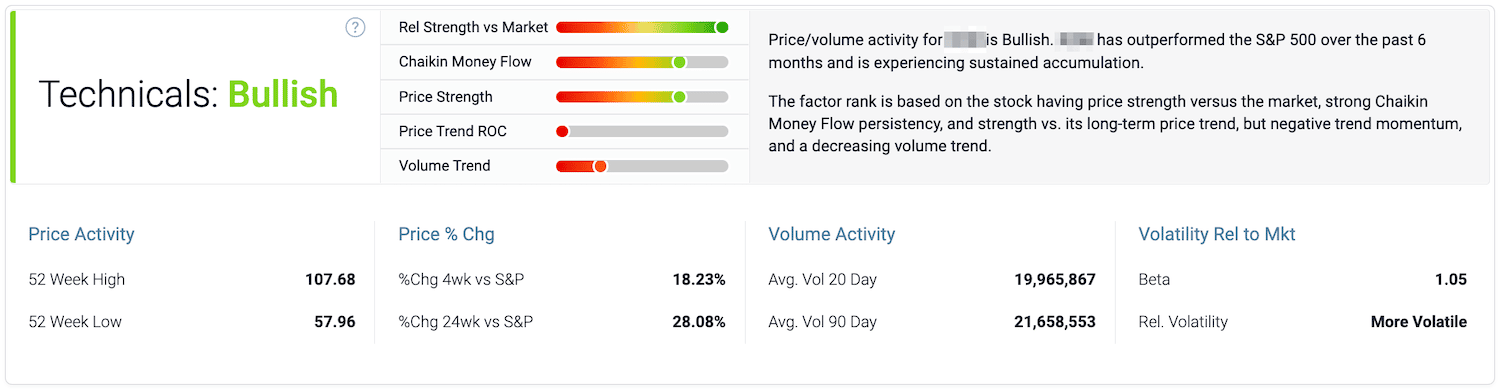
Technicals
Here’s what the “Technicals” metric involves:
- Relative Strength vs Market
- Chaikin Money Flow
- Price Strength
- Price Trend ROC
- Volume Trend
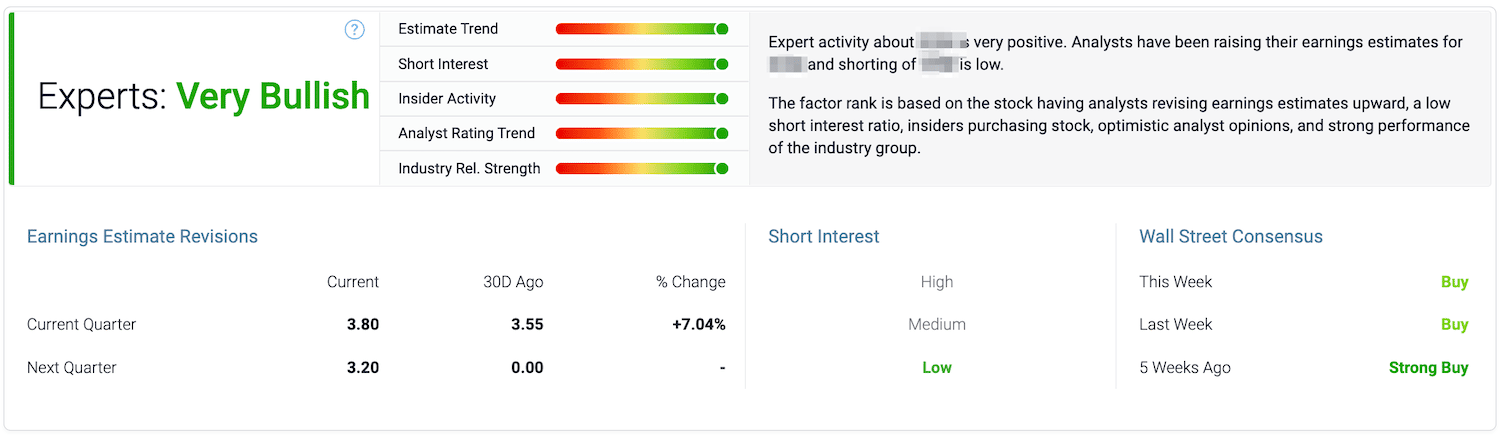
Experts
Last but not least, the “Experts” metric shows you this:
- Estimate Trend
- Short Interest
- Insider Activity
- Analyst Rating Trend
- Industry Rel. Strength
Chaikin Money Flow & Relative Strength
Aside from the Power Gauge metrics, you may also have noticed that there are two indicators under the price chart I shared earlier.
One is called the “Chaikin Money Flow” indicator, and the other is called the “Relative Strength” indicator.
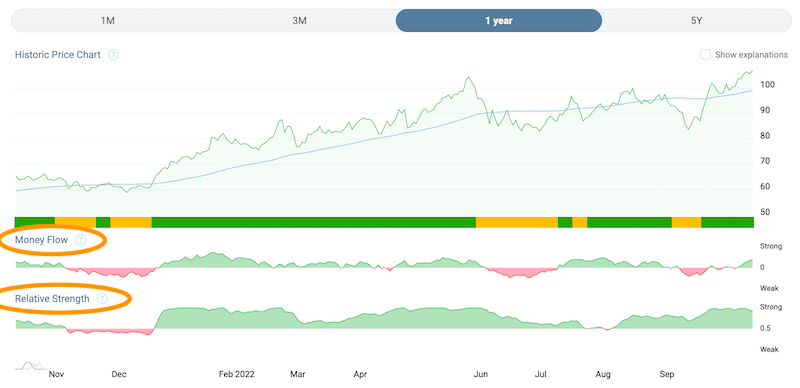
What’s the deal with these?
According to Marc Chaikin, these are both “timing measures” he uses to know when to buy the companies that the Power Gauge deems worthy.
Here’s a snippet from a report in the member’s area where he explains it:
“Our main tool is the ‘Power Gauge’… This is a quantitative tool that points us to the absolute best businesses and stocks. From there, we’ll look at timing measures like the ‘Chaikin Money Flow’ and ‘Relative Strength’ to continue our analysis.
“By combining these pieces, we’re able to find the best companies… and know exactly when to buy them.”
How do these indicators work?
I’m not an expert on technical analysis, but based on what the Chaikin Analytics website says, the “Relative Strength” component gives you an indication of the stock’s performance relative to the benchmark S&P 500 index.
If it’s in the green zone, that means the stock has been outperforming the S&P, and if it’s in the red zone, it means the stock has been underperforming the S&P.
As for the Chaikin Money Flow indicator (aka the CMF Indicator), this is an indicator Marc Chaikin developed in the early 1980s to measure the buying pressure vs. the selling pressure of a given stock over time.
According to Investopedia, the CMF indicator (aka oscillator) is similar to a different indicator called the money flow index, and both are “commonly used by active traders to monitor the flow of money and/or momentum.”
The above pages I shared explain how it works in more detail, so you might find those helpful if you want to know more. But that’s the gist of it.
Mastering the Chaikin Power Gauge
Depending on where you’re at in your investing journey, you may or may not be familiar with the metrics we just discussed, which make up the Power Gauge.
But as a subscriber, you get access to a guide inside the member’s area called “The Power Gauge: How to Double Your Money on the Best Stocks.”
And in this guide/report, Marc Chaikin walks you through exactly how the Power Gauge metrics work, which I think is really important to understand.
You could just use the Power Gauge and “trust” the ratings enough to make a decision on what stocks you like and don’t like.
But to me, that’s not a very good idea.
Why? Because, in that case, you’d be more or less blindly following a “bullish” or “bearish” rating without knowing what it truly means or understanding how the individual factors relate to one another.
And as such, you could end up putting a lot of trust into the system itself, which could end badly since there’s no guarantee it’ll pick a “winning stock.”
This is why I think it pays to do your homework, and what you get access to in the member’s area (i.e., reports, guides) should help you out in that respect.
There’s also an FAQ page on the Chaikin Analytics website that answers commonly asked questions about how the Power Gauge works (among other things). And there are countless free resources online, some of which I shared earlier.
Of course, you could also just follow Marc Chaikin’s stock picks, which he finds through the Power Gauge and, from what I understand, personally vets.
But I still think it’s worth doing your own due diligence.
Because no system is perfect.
And as I’ll now explain, not all of the stock picks have worked out…
How Have Marc Chaikin’s Stock Picks Performed?
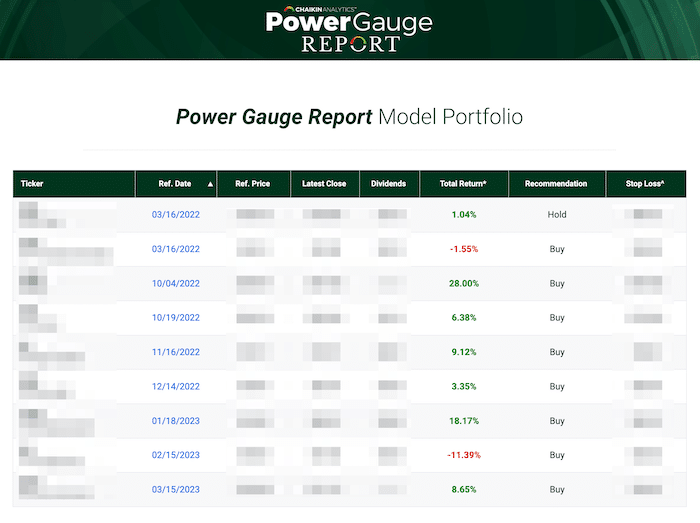
As with most research services I come across, the Power Gauge Report only shows you the “active” stock picks (i.e., recommendations that are still open).
Here’s a screenshot of the open positions as of April 19, 2023:
However, to find out how the service has (actually) performed since its inception, you need to see how the closed positions have faired.
And this is only possible by digging through the newsletter archives, which, for an older service, would take forever since there can be 100s of newsletters.
But finding that information was pretty easy in this case since the Power Gauge Report only launched in October 2021.
So, how have the recommendations worked out?
Not good.
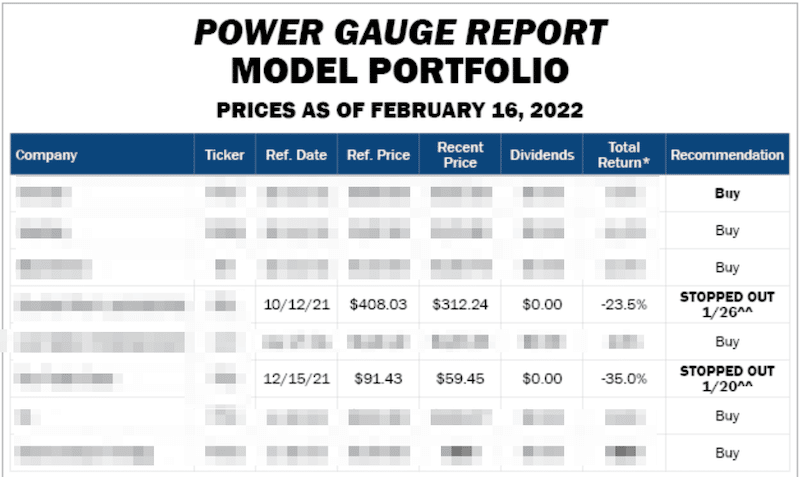
The closed positions, thus far, have been a bloodbath.
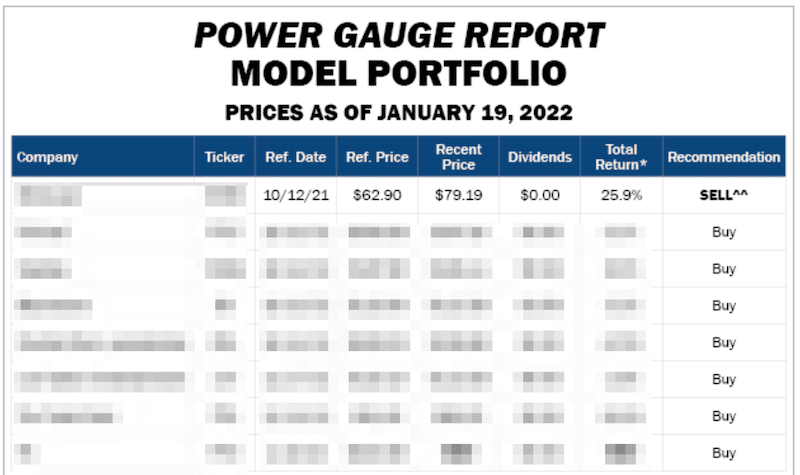
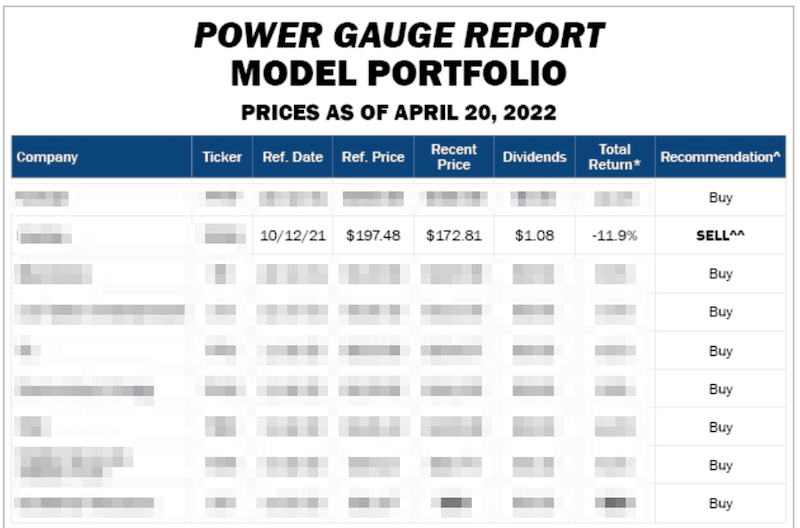
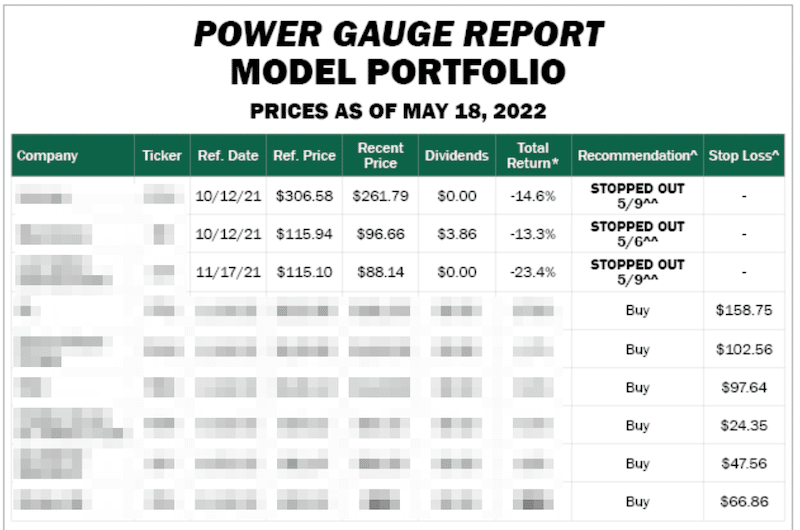
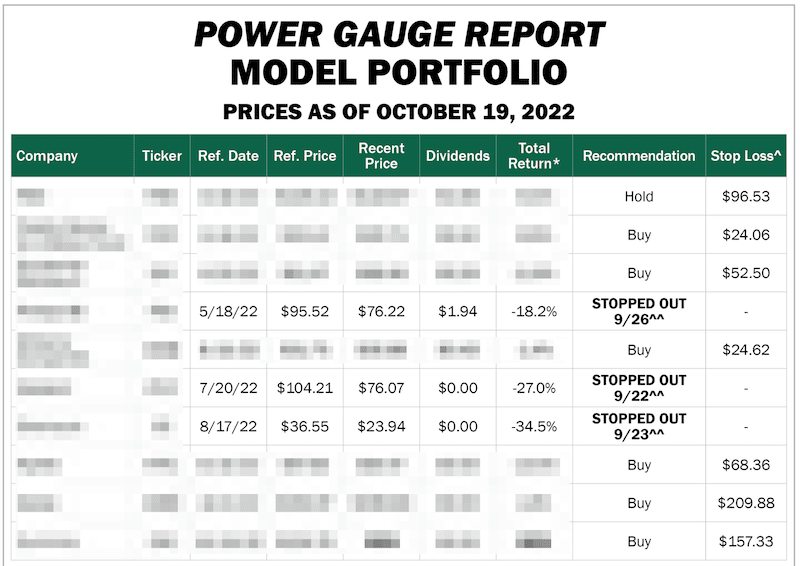
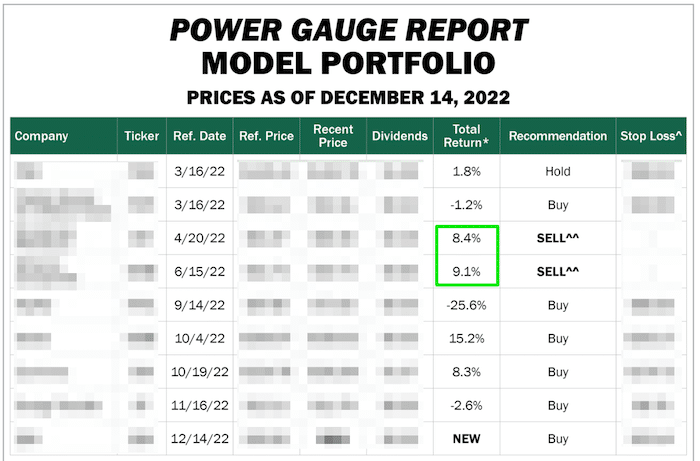
I can’t reveal the tickers because it’s a paid service, but the following is a running log of how Marc Chaikin’s stock picks have worked out since the service’s inception.
Note that I’ve only included screenshots of the portfolio during months where there have been sell recommendations, as my goal is to keep track of his closed recommendations.
January 2022
February 2022
April 2022
May 2022
October 2022
December 2022
January 2023
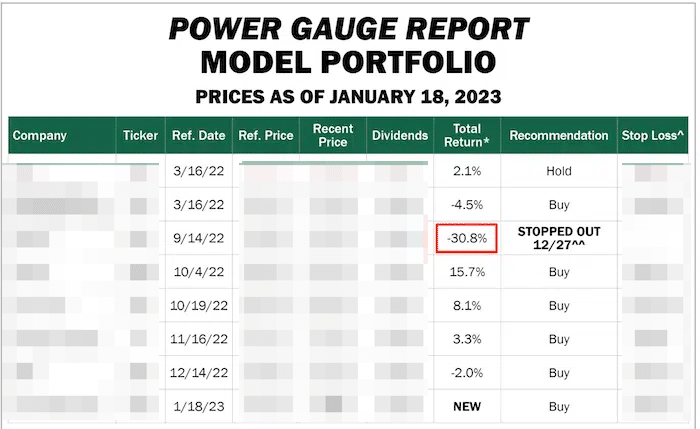
Summing Up the Model Portfolio
To Marc Chaikin’s credit, he recommends a trailing stop loss of 30% on all of his recommendations, which not every stock picker does.
And even though the site doesn’t exactly “advertise” what I just showed you, he does openly disclose the closed positions at the end of each newsletter.
Also, let’s be real… aside from energy, most stocks have been smashed this year, so Chaikin couldn’t have started this service at a worse time.
Of course, past performance doesn’t guarantee future results… and all that. No matter how well (or not so well) a service has performed, that’s not the best way to predict how things will work out for you.
But I think what I’ve shown illustrates that no stock-rating system is perfect. Even 50-plus-year Wall Street veterans like Chaikin get things wrong at times.
Is Marc Chaikin the Real Deal?

According to the Chaikin Analytics website, Marc Chaikin spent 40 years on Wall Street as a “trader, stockbroker, analyst, and head of the options department for a major brokerage firm.”
The site also says that Chaikin has been developing “computerized stock selection models and technical indicators” for over 50 years.
Is that true?
It’s hard to verify every detail of his story, but Marc Chaikin has an extensive resume that few in the industry could match. So yes, he is the real deal.
Here are a few main reasons I say this:
- For starters, he came up with the Chaikin Money Flow (CMF) indicator, which, as I mentioned earlier, is widely used by traders to measure the buying vs. selling pressure of stocks over time.
- Second, he collaborated with Nasdaq to develop three “Nasdaq-Chaikin indexes” in 2014. In 2017, two new ETFs were launched by IndexIQ and Chaikin Analytics that “leverage the Chaikin Power Gauge stock rating.”
- Third, Marc Chaikin once ran his own institutional brokerage firm that served multi-billion-dollar clients. And one of those included D.E. Shaw, the hedge fund Jeff Bezos worked at back in the day.
Needless to say, Marc Chaikin has had a very successful career, and he is a respected investment expert by any measure.
How did he get into the newsletter business?
Well, after retiring in 2000 and having some time off, Marc Chaikin launched Chaikin Analytics (formerly known as Chaikin Power Tools) in 2011 to, as the company site puts it, “bring his knowledge to everyday investors.”
So, while the Power Gauge Report service we’ve been discussing first started in late 2021, the Chaikin Analytics website has been around for over ten years.
And it sells numerous other services.
For example, the “Power Gauge Investor” service, which costs $5,000.
Does he have a good track record?
Marc Chaikin claims to have made numerous accurate predictions throughout his career regarding market tops and bottoms, as well as individual stocks.
For example, in a recent presentation on the chaikinanalytics.com website, he says he “predicted the 2020 crash,” “warned a bear market was coming” in April 2022, and “survived and even thrived” through numerous other bear markets.
What’s he predicting now?
Well, in the same presentation, Chaikin says he believes we’ll “see a historic financial reset in 2023” and that the stock market losses could get worse.
“Over the past year or so, I’ve warned 8.4 million people that I believe we’ll see a historic financial reset in 2023.”
[…]
“People have seen serious losses in the stock market… and I think it’s going to get even worse… especially in 2023.”
Source: https://secure.chaikinanalytics.com/?cid=MKT579436&eid=MKT681548&assetId=AST262923&page=2
It’s impossible to know if what he’s predicting will happen or not.
Maybe it will; maybe it won’t. But the above presentation points to the Power Gauge Report as the “solution” to what he’s warning about.
And given the fact that most of the Power Gauge Report stock picks are down as of writing (October 2022), it’s clear that not everything he and his system have “predicted” (at least as far as stocks go) has worked out.
So even though Marc Chaikin is a legitimate expert with decades of experience, and he does appear to have a good track record, there’s no guarantee that his recommendations or stock rating system will make you money.
Bottom Line: Worth It or Nah?
The Power Gauge (aka “Power Pulse”) tool alone is enough to justify the $49 asking price. I wouldn’t recommend blindly following it, as the “bullish” and “bearish” ratings it spits out are only a guide, but it’s very comprehensive.
You can type in any stock ticker you want and get a near-instant breakdown of the 20 factors Chaikin Analytics uses to evaluate the company.
You can even use the system to analyze ETFs.
It doesn’t cover everything, but there are currently over 5,000 stocks that you can analyze. And from what I can see, the info is updated often.
As for the reports/newsletters, these are very informative and explain in detail why Marc Chaikin is recommending a given stock. He also explains how it relates to what is shown in the Power Gauge rating.
Not to mention, you get a bunch of research reports that cover different companies Chaikin is recommending.
Oh, and the promo page I joined through gave me a free one-year subscription to a Stansberry Research service called True Wealth, which is pretty cool.
So to me, the Power Gauge Report is definitely worth it.
Does that mean it’ll make you rich?
Nope.
There’s no service in the world that can promise you that.
In fact, as I’ve shown in this review, it’s even possible you can lose money by following the recommendations, which is true for any service.
But the Power Gauge Report is legit and potentially worthwhile, especially if you’re interested in using Chaikin’s stock-rating system.
Overall, this service gets a “neutral-bullish” rating from me.
I would rate it higher, but I want to give it time to see how the stock picks perform, as so far, they haven’t lived up to the hype.
Anyway, that’s it from me.
Thanks for reading; I hope you found this helpful.


Im a lifetime subscriber thank goodness. Wonderful product ! I will not buy a stock or stock option without thoroughly checking it out through Power Gauge.
But Im puzzled about the valuations and commentary alongside Twist Bioscience. Despite a great bullish commentary the stock keeps falling even though the products are very impressive. Weiss gives it a D- but I would prefer to believe PG . Any thoughts ?
Also I think that there are some underestimates regarding FLNG who I suspect are absolutely minting profits on the back of the arbitrage provided by a huge discrepancy between natural gas prices in the US compared to the longer term much higher contact prices for Liquid Gas being exported to Europe. Wewill see when the company reports shortly but I’m mildly surprised that your system which is forward looking hasn’t spotted the underlying potential . anyway – super product . I recommend it to everyone
Excellent, informative review. I just sat through the entire presentation waiting to see if I should purchase it, the whole time searching reviews for what real people had to say and your article was the most helpful. I think I will buy it for the info it provides but not hold my breath on finding a genie’s lamp… I’m just very wary of these bank failures and the WEF total reset and wondering what to do with my little stash. Thanks again & all the best to you!
Great, glad it helped Barb, and appreciate your comment!
Tim
Nice analysis
Given Chaikin does not publish – real investment results of his stock picks – Performance for results of picks 2022 YTD, 2021… They are not providing any information to help market their products. Other than Reverse Engineered Stock Presentations- You have to assume the Suggested picks
in the weekly published portfolio have not done well.
Yeah, you’d think that many of these stock-picking services performed amazingly well based on their sales pitches, but then you join and the reality sets in.
Anyways, glad you found the post helpful and all the best.
Is there a magic stock recommendation system to make you rich?
NO, nowhere in the world? I use Motley fool and my losses are totally over 35% up to even 90% on some stocks.
Thanks for your report, it is well documented, glad to have read this.
Pleasure, glad it helped.
Hi Tim,
Just letting you know this was an awesome article. I’ve read a few reviews on Power Gauge so far, and this one was by far the most helpful and down to Earth.
Thanks a bunch,
Austin
Great to hear, Austin, and appreciate your comment.